planviz
The figure library for OpenPlan Labs — grid maps, search animations, plan timelines and benchmark charts, in the Frontier palette, light and dark from the same call.
Planners not included. This draws results; it does not produce them.
import planviz

grid = [[0, 0, 0, 0], [0, 1, 1, 0], [0, 0, 0, 0]]   # truthy = blocked

ax = planviz.draw_search(
    expanded=[(0, 0), (1, 0), (2, 0), (2, 1)],
    frontier=[(0, 1), (2, 2)],
    path=[(0, 0), (1, 0), (2, 0), (2, 1), (2, 2)],
    grid=grid,
)
planviz.save(ax, "search.png")
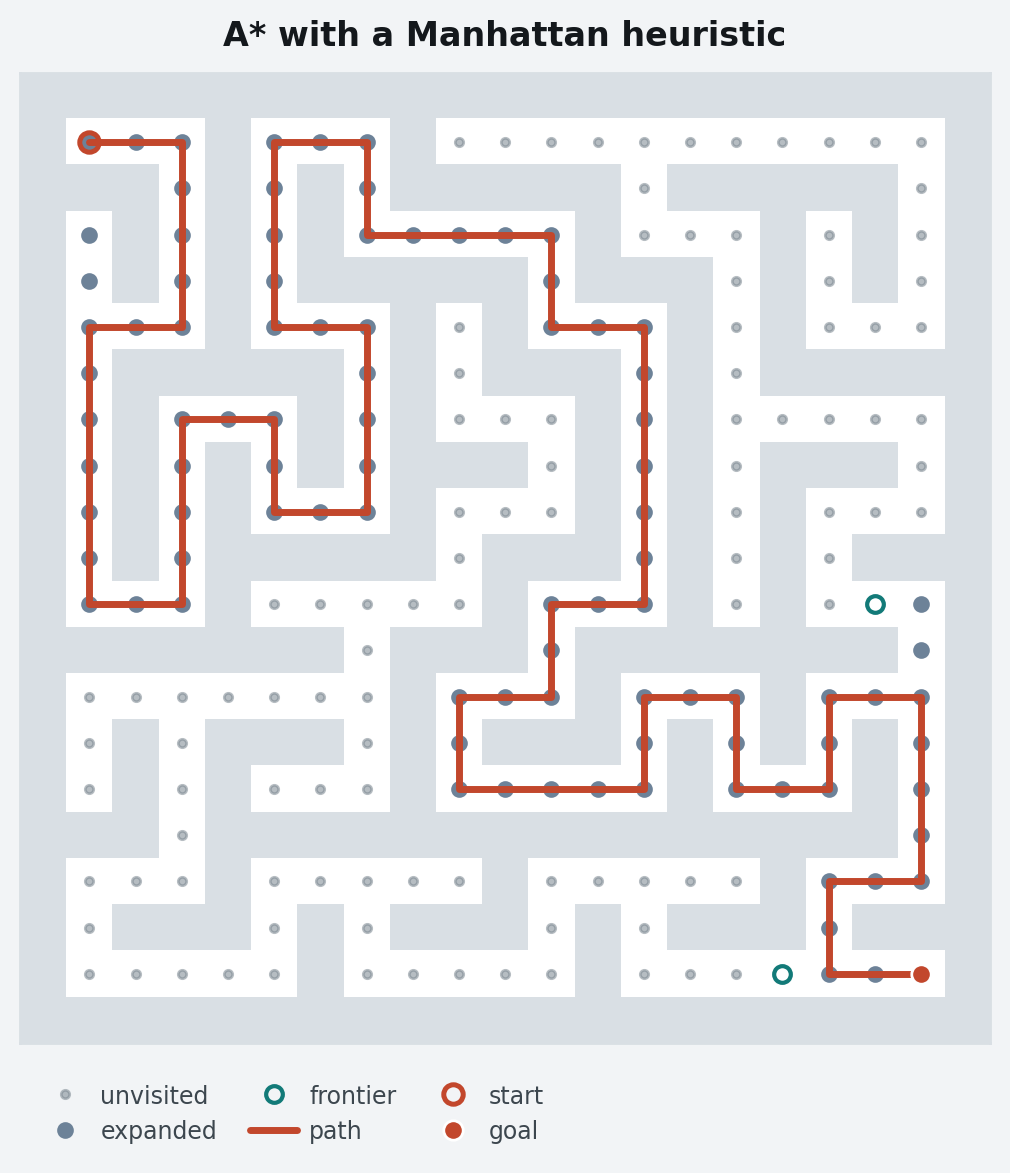
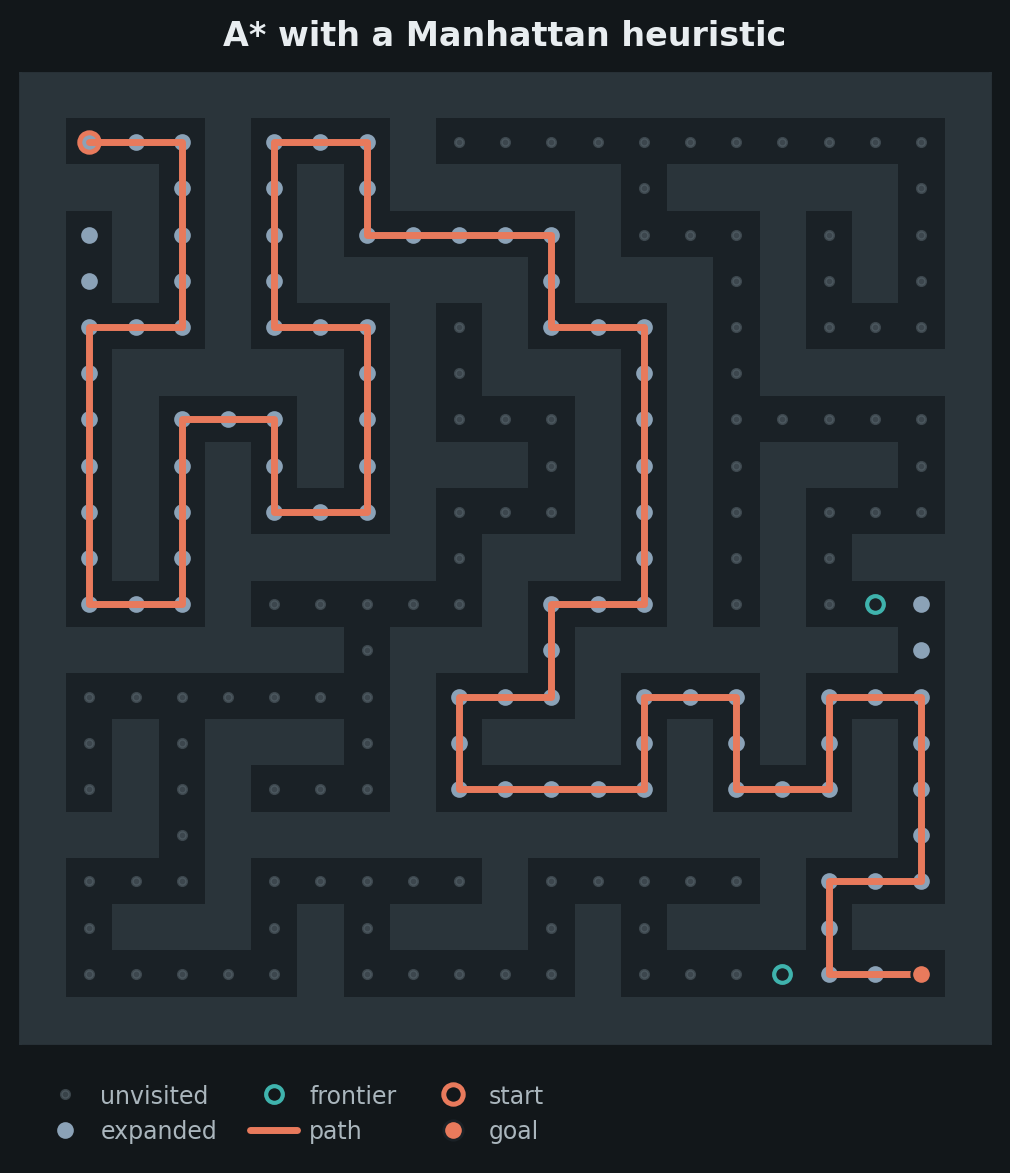
That figure is why the package exists. Every search algorithm has the same three sets — the nodes it expanded, the nodes on the frontier, and the path it returned — so the brand's three colours are that legend, and the three sets differ by shape as well as hue, which is the channel that survives greyscale printing and red/green colour blindness. Drawing it correctly by hand, in four repositories, twice each for light and dark, is the duplication this replaces.
The four contracts
Importing planviz changes no matplotlib state. The style is applied by
use_style, or per-figure inside a
style_context that restores rcParams on
exit. A solver library can depend on this without repainting its user's
notebook, and the test suite asserts it in a subprocess.
Every figure function takes dark: bool = False and an optional ax=.
Light and dark variants come from one call; figures compose into panels.
Nothing is saved or shown for you. Functions return the Axes they drew on
— or the Figure, for multi-panel figures. planviz.save(...) is the explicit
write, and a test monkeypatches savefig to prove no figure function reaches
for it.
The brand ships inside the wheel. planviz/tokens.py and
planviz/styles/frontier.mplstyle are generated from
openplan-labs/branding by
scripts/sync_tokens.py, and a CI job fails the build if the committed copies
have drifted. Nothing looks up a repository at runtime, and a figure rendered
on an offline runner matches one rendered on a laptop.
No planner types
planviz imports no solver. Its vocabulary is:
| Concept | Shape |
|---|---|
| A grid | 2-D array-like, grid[row][col], truthy means blocked, row 0 at the top |
| A path | sequence of (row, col) pairs |
| Multi-agent paths | {name: path}, or a sequence of paths named by index |
| A search's sets | sequences of (row, col) cells |
| A search tree | flat (node, parent, depth[, value]) records; parent == -1 at the root |
| A plan | action names, or (label, start, duration[, row[, kind]]) steps |
| A benchmark series | {name: {x: [samples over seeds]}} |
Anything that can produce those can be plotted, which is what lets one library serve a MAPF solver, a GPU planner and a PDDL planner without any of them importing each other.
Where to start
- Install — two dependencies, one optional extra.
- Gallery — every figure, with the call that draws it.
- Design rules — what the library enforces, and why.
- API reference — every public symbol.
- Migration — moving
pymapf,cuplanorjupyddlonto this.